

Gold has experienced nine or more consecutive weekly gains only a few times in its modern history, signalling periods of strong bullish momentum. However, these prolonged winning streaks are typically followed by short-term pullbacks or consolidation phases, driven by overbought conditions and profit taking.
The recent streak marks just the seventh occurrence, with previous instances recorded in 1970, 1977, 1980, 1983, 2006, and 2020.
Historical analysis reveals a consistent pattern: after such extended rallies, gold usually enters a consolidation period lasting around 100 days. In 83.3% of these cases (5 out of 6), negative returns were observed within 20 to 80 days following the streak, with gold often declining by 5–10% as the market digested prior gains. This underscores gold’s propensity to pause or correct after long winning streaks, even during an overall uptrend, potentially providing market participants with opportunities to reassess entry points at more attractive levels.
Indeed, and taking into consideration the above, it is worth noting that gold surged 26% from September through this Monday, peaking at a record $4,378 per ounce before pulling back 6% on Tuesday to around $4,100 per ounce. While this selloff was likely driven by corrections in speculative call options, we believe sustained, structural demand will persist, and we continue to see upside risk to our $4,500 end-2026 forecast, fuelled by growing interest in gold as a strategic portfolio diversifier.
Notably, robust inflows likely continued through September and October, supported by seasonal central bank purchases and the effects of Federal Reserve rate cuts and diversification trends boosting ETF holdings and ultra-high-net-worth physical gold buying – flows that are typically gradual and not fully reflected in ETF data.
Despite the strong demand backdrop, the 6% Tuesday pullback occurred amid limited CFTC speculative data due to the US government shutdown. However, daily COMEX open interest and call option pricing indicate that speculators likely reduced exposure during the downturn.
This retreat partially reflects a spillover from silver, which has dropped 11% since Friday. A recent sharp decline in silver lease rates in London suggests an easing of the locational squeeze that had propelled silver’s earlier rally, causing prices to reverse sharply and likely triggering cross-metal unwinds that pressured gold lower.
We maintain our $4,500 per ounce target for end-2026, underpinned by ongoing central bank demand and revived investor inflows as the Fed eases. The pace of ETF inflows and client feedback suggests many long-term investors – including sovereign wealth funds, central banks, pension funds, and private wealth and asset managers – plan to boost gold exposure as a strategic diversifier. These investors operate on multi-quarter approval cycles and multi-year horizons, suggesting a significant upside risk to our forecast. Should private investors increasingly seek value outside the financial system amid global macro uncertainties – including fiscal concerns – even modest reallocations away from global bonds and equities could substantially elevate prices in the relatively small gold market.
Gold Miners ETF: Bearish Signals Emerging
The VanEck Gold Miners ETF (GDX-US) has surged to a new high, boasting a remarkable year-to-date rally of nearly 150%. After breaking above the upper boundary of its consolidation phase that began in 2021, the price entered a parabolic ascent, surpassing multiple resistance levels.
Adding to the cautious outlook, the weekly chart shows a potential shooting star candlestick pattern, often a bearish reversal indicator. The price surged early in the week but reversed sharply by Friday, closing near the week’s lows. This pattern suggests fading upward momentum and raises the possibility of a corrective phase.
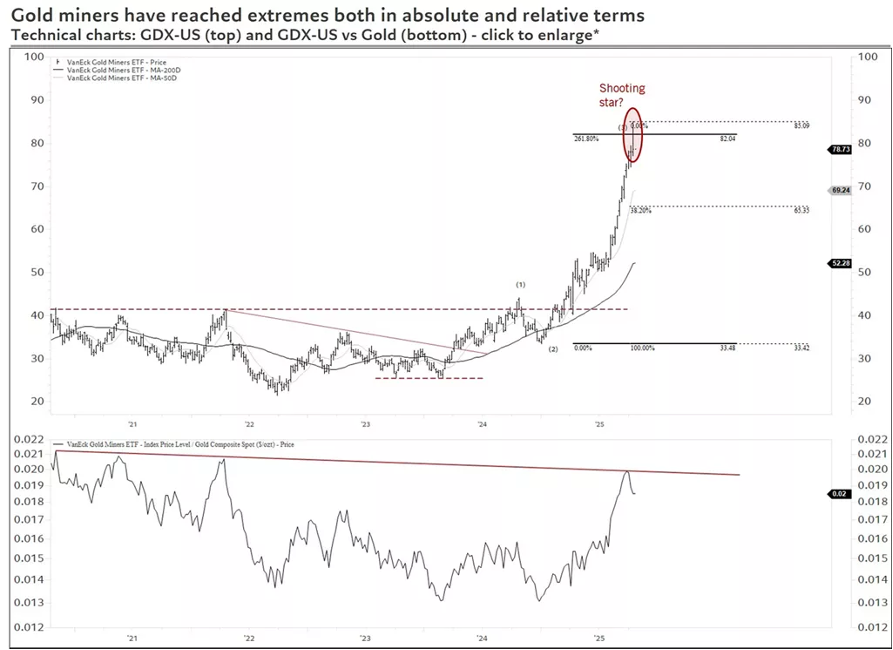
Moreover, the gold miners have continued to outperform gold itself, pushing the gold miner-to-gold ratio toward a key downtrend line connecting highs since 2020. This relative strength highlights the leveraged nature of miners during gold rallies but also signals caution as the ratio nears critical resistance. A reversal in this ratio, which appears underway, combined with the potential shooting star formation on the gold chart, could herald a broader sector correction.
